How can we help?
DataXchange Tab Interface
Overview
The interface of the DataXchange tab is separated into 5 panes: the ribbon bar, the equipment tree, the detail section, the message window, and the service log.
The Ribbon Bar
The buttons in the ribbon bar will vary depending on whether or not the Client is connected to a DX Service. When disconnected from a DX Service all of the visible buttons will perform tasks that can be done while disconnected from a DX Service.
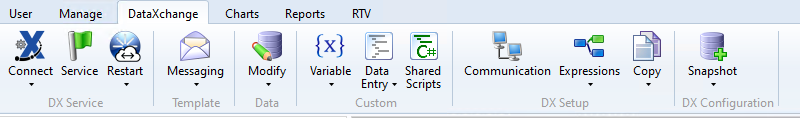
Once Connected to a DX Service a few of the buttons will change and the ribbon bar will fill with some additional buttons.

The DX Service section is used to connect to a specific DX Service. See configuration and settings information below.
A green or red flag is used to identify whether or not all of the monitored DX Services are currently communicating with the Cloud servers. When disconnected, any of the monitored DX Services that have not been in contact with the Cloud servers for more than 2 minutes will display a red flag. If all of the monitored DX Services have been in contact with the Cloud servers within two minutes then the flag will be green. When connected clicking on the flag will bring up the DX Settings. More information can be found here.
The Restart button is used to remotely restart the DX Services. While services are restarting, a cloud icon will appear indicating a connection to the PCS cloud as seen in the first screen shot. Once you are re-connected to the DX Services the cloud will disappear. The Scytec DataXchange PCS Update Service must be running for the remote restart functionality to work properly. Detailed information about the service can be found here.
The Email button in the Template section is used to Add, Create, and modify email templates to be used in expressions.
The Modify button in the Data section is used to change data that has been previously collected. This is an administrative function allowing previously collected data to be adjusted in the event that the data was not collected appropriately. More information can be found here.
The Custom section has two buttons. The first is used to customize Variables. The Data Entry section is used to create and assign Custom Commands.
The DX Setup section is used to create and modify the communication and expression definitions. The Communication button will bring up the Communication Information page which allows Sources and Targets to be added and configured. The Expressions button allows the Expressions to be created or assigned, and the Copy button allows communication and expression information to be copied and pasted to other pieces of equipment.
The DX Configuration is used to create a Snapshot and export the current DX Service configuration. Click here for more detail.
In the DX Commands section there are three buttons which provide the ability to start and stop the equipment from listening for data as well as to modify the startup type for each piece of equipment.
- The Start and Stop commands work at the node level within the tree. If an individual piece of equipment is selected, the buttons will control only the selected equipment. If a group node is selected, all equipment in the group will be controlled.
- The Startup button allows the startup type of each piece of equipment to be changed. Options include:
- Automatic: The DX Service will automatically start listening for data from the machine when the DX Service is started.
- Manual: A user will need to connect to the DX Service and start the DX Command for collection to occur.
- Disabled: Data collection will not start for machines in the disabled mode.
- Automatic Restart: The DX Service will automatically start listening for data from the machine and will try to start the DX Command again if it is stopped for any reason.
The DX Logging allows viewing of activity on the selected equipment while it is connected to DataXchange. More information on live logging can be found by clicking here.
The MTConnect, Focas, SRCE, and Modbus TCP Data Viewers are used to display the data stream values being returned from various data sources. Data is automatically refreshed as long as the viewer is connected.
Equipment Tree
The Equipment Tree will show at all times when accessing the DataXchange tab. When disconnected from a DX Service the Equipment Tree will display all plants, equipment groups, and associated equipment regardless of the DX Service. The red and green state badges on the icons next to each of the equipment will not be displayed when disconnected from a DX Service.
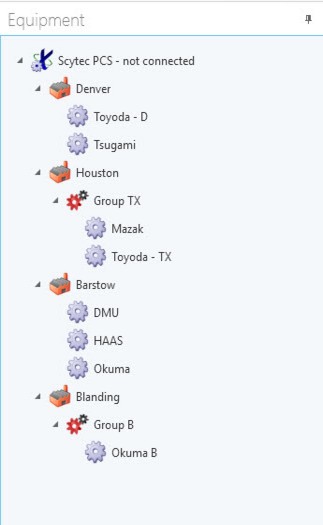
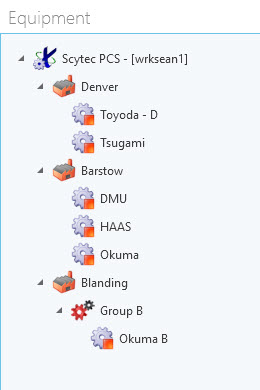
When connected to a DX Service only the equipment associated with the selected DX Service will be displayed with the badge icons. All other equipment not associated with the connected DX Service will not appear. In the example below, our equipment in Houston, which is visible in the screen shot above, is assigned to a different service so it no longer appears in the tree.
Badge Types
There are three different badge types when connected to a service.
| Type | Description | Action |
|---|---|---|
| Equipment is connected to a service but communications or expressions have not been assigned or the command has been stopped. | Assign communication and expressions. If this has been done select the start command button. | |
 | Communications and expressions have been correctly assigned. DataXchange is communicating and collecting machine data. | No action needed. This machine is collecting data. |
| An error has occurred and data is no longer being collected from this equipment. | Restart the DX Service and select the Start command button. |