How can we help?
Equipment OEE Views
Equipment OEE Grid
The OEE Status Grid displays Availability, Performance, Quality, and OEE for individual pieces of equipment as well as summarizing the values for each of the OEE metrics. Additional information is available on the OEE calculations page. If the grid contains blank values then something may not be configured correctly or data may not have been collected yet for the selected time period. Please see here for more information on how to configure and setup OEE.
This grid view is broken down into two main parts. The bar and number in the top section represents the weighted average for the values in the associated column, while the blue dot represents the target.
The bottom section displays what each machine’s current value is. Each cell’s color is determined by the targets configured under Metric Options and the Metric Targets defined for each machine.
Configuration Options
The Equipment section is used to select the equipment that will be displayed in the View. The Dynamically Add New Equipment checkbox can be used to automatically add new equipment to the View.
- Columns: Select the columns displayed on the grid.
- Sorting: Predefined options on how to sort the data.
- Metric Options: Determine the thresholds for the different target colors. The color of the bars and cells will change based a percentage of the defined target.
- Grid Settings: Additional customization options such as font size, the time frame for the data shown, whether to display specific values, and which color background the Equipment name field should have.
- Summary Settings: Choose whether to display the Summary section and the averages and targets within it.

Equipment OEE Summary
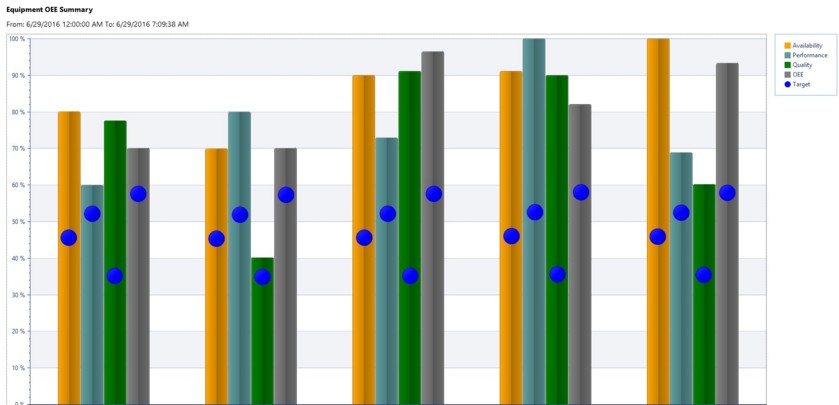
The Equipment OEE Summary View is a 4 tier bar graph for analyzing OEE specific metrics. The chart is capable of of displaying Availability, Performance, Quality, and OEE data. It is also possible to plot the targets for each metric alongside the returned values. Use the filter to customize the view.
The following options are available:
- The Metric Options are used to select which metrics to display on the RTV screen. Uncheck the box to hide any of the following metrics:
- Availability
- Performance
- Quality
- OEE
- Target
- The Settings determine how the view is displayed.
- Font size: Change the Size of the font to better fit your screen.
- Reset Interval: Customize the time frame displayed on the view.
- Legend: Toggle the Legend on or off.
