How can we help?
Browser Data Display Application
Overview
The Scytec DataXchange Data Display Application runs as a web site in a browser and as an app on mobile devices. The browser version is located here: [Your DataXchange Server]/datadisplay. This page describes the basic usage of the app including the initial login as well as some of the features of a few of the items.
Note: Due to potential security risks, LDAP authentication is not supported in Data Display. A DataXchange password must be used. If one has not been set, you will be prompted to create one upon first login.
Video

Logging In
The first time the application is run on a device the account information must be entered, therefore the Account Setting page will be displayed. If your account uses the DataXchange Cloud service then SSL must remain enabled. If your account is an On Premise deployment then the appropriate site and SSL settings must be entered.
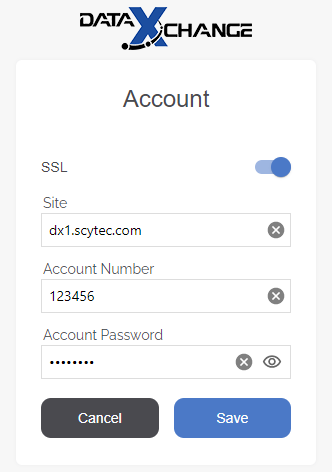
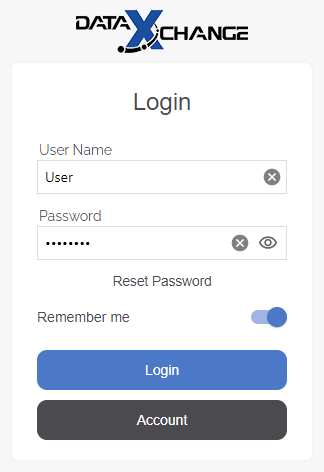
Once the account information has been saved the login screen will appear. The app is designed to work from browsers and mobile apps from outside corporate networks so only DataXchange authentication is supported. LDAP and Microsoft Active Directory authentication types are not supported for the web application.
If you forget your password you can click Reset Password and enter your Company Email address. A new password will be emailed to you.
Navigating the Reporting Application
Once logged in the main Launch Pad page will appear. This is where the charts and dashboards can be launched from. Pressing any of the icons will navigate to the Filter page for the associated Chart or Report. Each chart, report, export, and real time view is controlled by permissions within the main DataXchange application.
Note: Dark Mode is available in Data Display and will be applied based on the current OS system setting.
Grouping and Layout
There are multiple ways to view and sort the icons on the Launch Pad. These options include Grouping and Layout.
Grouping determines the categories the different charts and reports will be displayed in. By Format groups them by how the data is presented. Charts are grouped together with each other, as are Reports, Exports, and Real Time Views. Then the different custom Saved items are listed below, similarly grouped.
Grouping By Function will group each item by what kind of data is displayed. Equipment Status charts and reports are grouped together. Then Utilization and Downtime in its own group, followed by Parts And Work Orders, then OEE and Operations, and finally Other.
Layout determines how the icons are displayed on the screen. The Standard Layout lists each section in order vertically, with the icons spread horizontally across the screen.
The Filter box allows searching for specific charts or reports. Enter text in the box and the page will only display items matching the text. Items can be permanently filtered out by individual users from the Manage page.
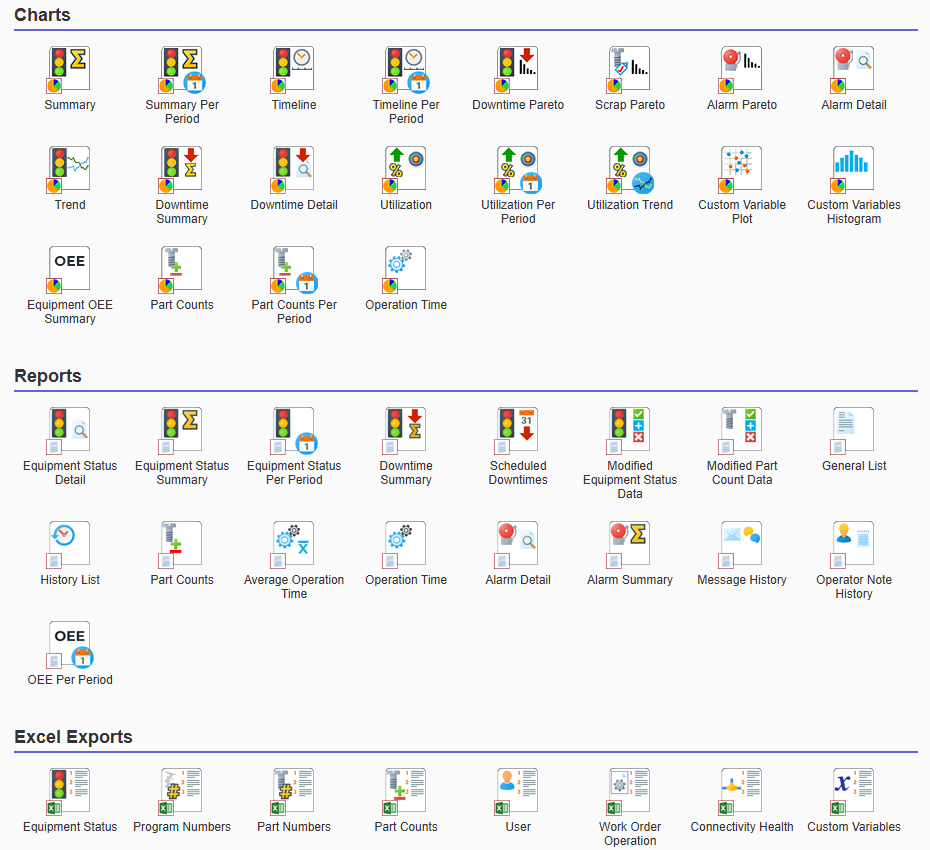
The Columns Layout is a more compact interface creating a scrollable list for each subcategory.

Main Menu
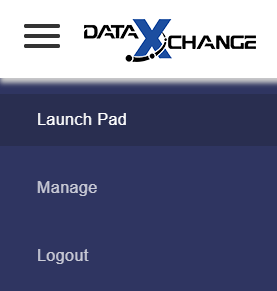
The menu bar on the left allows navigation back to the Launch Pad (home page) from anywhere. The user can also log out of the application and, with the appropriate permissions, manage settings from here.
Filter Pages
When you first click on a Chart, Report, Export, or Real Time View, a page containing the filter options for the selected item will be displayed. Select the desired time frame, equipment, and any other additional options depending on the chart you want to view. When finished, click the appropriate button in the top-right corner. To go back to the filter page, click the Filter button. For additional options while viewing the chart, click the Options button. When exporting an Excel report, click the Export button once the correct filter settings are selected. The Launch Pad button will return the user to the home page.

The filters in the browser and mobile reporting are designed to remember the selections for each user. All applicable settings will carry over between charts as well. For example, four pieces of equipment are selected for last Tuesday from 6:00 AM to 10:00 AM when running the Equipment Status Summary chart. When going to the Equipment Status Timeline chart the filter will have the same settings by default. The settings are also retained regardless of whether the filter is used on a PC, a browser, or within one of the mobile applications.
Manage
The Manage allows for modification of a few different Data Display options.
Log-in Landing Page
Allows the user to choose what page will be loaded upon initial login. This is useful for allowing automatic login to Real Time Views.
Launch Pad Filter
This section allows individual icons on the Launch Pad to be turned on and off. This is useful for if certain charts and reports are not useful to a particular user, that user can hide the icons.
Reporting Groups
Use this section to create and modify Reporting Groups, either for the logged-in user or for the entire Company. Additional details can be found here.
Company-Assigned Saved Charts and Scheduled Charts
A list of charts assigned to user groups will be shown here so permissions and email assignments can be configured by Administrators who may not have access to a given Chart.