How can we help?
Options and Filters
Web Based Charts and Reports
DataXchange Charts are available via the web-based Data Display application, as well as within the DataXchange Windows Application. These charts can be viewed in a browser or in the DataXchange mobile app. There are some interface differences when viewing a web based chart. The web charts can be viewed using Data Display and more detailed information about the charts can be found here.
Quick Select
The Quick Select allows the Start Date / Time and the Stop Date / Time to be set quickly based on common time frames such as Current Hour/Day/Week/Month and a wide variety of the most recent Days, Weeks, Months
The Include Current checkbox will adjust the date range to include the current Day, Week, or Month. For example, selecting Last 2 Weeks and checking this box will generate a chart for the current week and last week. If the box is unchecked, last week and the previous week will be shown.
Once the desired equipment has been selected, charts can be generated without specifying any additional information by selecting the Chart button in the upper right hand corner.
Once a web chart is generated a gear or Options button will appear in the upper right hand corner. These options will vary based on the chart generated, and these Options are not available on all charts, therefore at times the options panel will remain blank or unavailable.

This Additional Options panel also contains printing, viewing and exporting options for the generated chart.
Printing Charts
The Print button, when pressed, will automatically resize the chart to fit the selected size of paper. Typically Letter (8.5″ X 11″) size paper is the most common, but additional predefined options are available including Legal (8.5″ X 14″), Tabloid (11″ X 17″), A3, A4, and A5.
NOTE: After clicking print you will also need to select the correct size of paper in your web browser’s print settings.
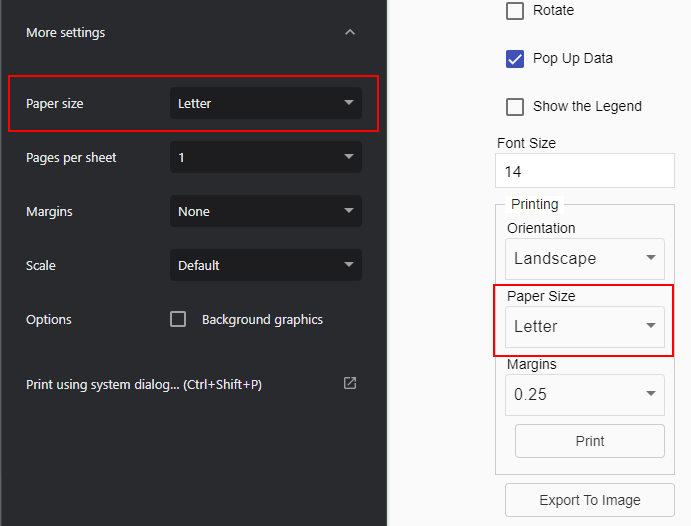
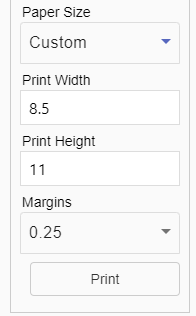
Due to variations in printer drivers, it is possible the selected paper size does not resize the chart to the preferred size. In this case, select the Custom option and adjust the dimensions as desired.
Exporting Reports
Text reports can be exported to Excel files. When configuring filters for these exports, the Chart button will change to an Export button. Click the Export button to download a file based on the configured filtering options. The file will be placed in the download location as defined by your web browser settings.
Reports – Options Panel
Within the DataXchange Windows Application, the Options panel is used to provide viewing options once a report has been generated. These options will vary based on the report generated, therefore the panel will be blank until the data appears. Options are not available for every chart or report, therefore at times the options panel will remain blank.
The Options panel also contains printing and exporting options for reports.
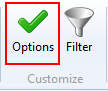
The panel can be expanded or retracted by using the Options button in the ribbon bar or by the Options label on the side bar. The panel can be floating over the screen below it or it can be pinned and push the screen below it to the side. The pin icon in the upper right corner can be pressed to pin or unpin the panel.
Export/Print Data as an Image
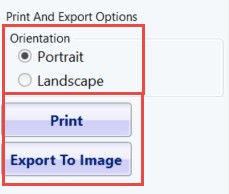
The displayed report data can be exported to an image file for storage or presentation at a later date. You access this feature by using the Options selection from the Customize section of the ribbon bar or expanding the options pane from the left side of the report or chart.
Once you have built out a report the the options will be populate, you can select the orientation as well as Print or Export To Image.
Filter Panel
The filter panel is used to select the information such as the time frame and the equipment to generate the desired chart or report. The filter options may vary based on the chart or report generated. The filter panel is displayed when you select a chart or report and can also be displayed while a chart or report is already on screen.
The panel can be expanded or retracted by using the Filter button in the ribbon bar or by the Filter label on the bottom bar. The panel can be floating over the screen below it or it can be pinned and push the screen below it up. The pin icon in the upper right corner of the filter panel can be pressed to pin or unpin the panel.
Quick Select
The Quick Select allows the Start Date / Time and the Stop Date / Time to be set quickly based on common time frames such as This Hour, Last Hour, Today, and Yesterday.
The Include Current checkbox will adjust the date range to include the current Day, Week, or Month. For example, select Last 2 Weeks and checking this box will generate a chart for the current week and last week. If the box is unchecked, last week and the previous week will be shown.
The Filter Grouping controls the layout in the selection tree. If Reporting Groups have been created the equipment can be displayed by these groups or just by Equipment.
Required and Optional Information
A time frame and one or more pieces of equipment are required to generate most charts or reports. Once the equipment has been selected the Finish and Next buttons become available. At this point the chart can be generated without specifying any additional information by pressing the Finish button. Additional optional information can be selected by pressing the Next button.
Some charts or reports require selection of a part number instead of equipment. Others will require selection of a Custom Variable in addition to a date range and equipment.
In most cases the second page of the filter can be used to select the type of statuses to be compared. By default the General status is selected. In some cases this section also allows you to filter by part number and work order if desired.
Duration Display Format settings will change the units of time associated with durations. Options include:
- Hours, Minutes, Seconds (hh:mm:ss)
- Hours and fractional hours (hh.xx)
- Minutes and fractional minutes (mm.xx)