How can we help?
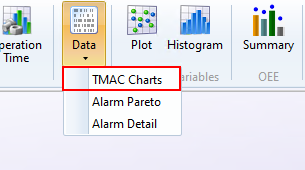
TMAC Data Charts
Overview
The TMAC Charts display data collected from Caron Engineering TMAC systems. Multiple different charts can be created with the filters available, and drill down charts are available for the viewing of all the detailed data acquired.
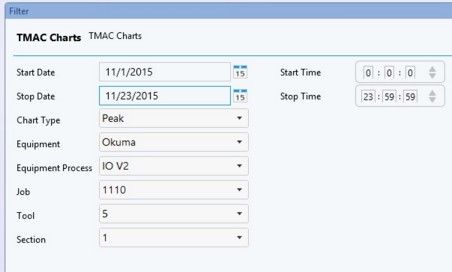
Filter Options
All of the information on the Filter is required to run the chart. Many of the options are dependent on the option selected above it. For example, once Equipment is selected the Equipment Process options will become available for the selected equipment. The same is true for the Job, Tool, and Section drop downs. Additional detailed information can be selected by highlighting from the generated chart.
TMAC Charts
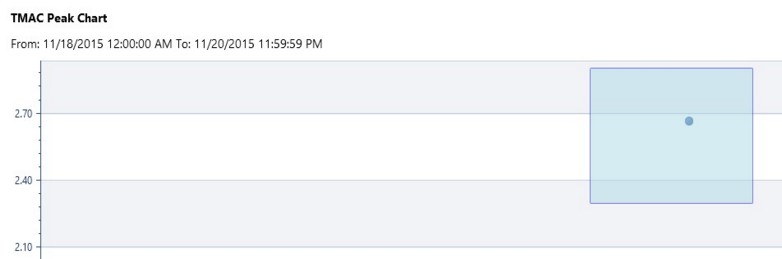
The Peak chart will show the peak HP reached during the associated cut.
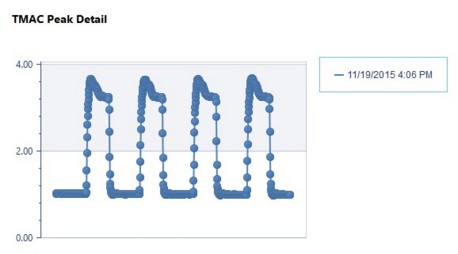
The detail chart will display all of the individual data point acquired during the cut.