How can we help?
Schedule an Emailed Chart, Report, or Export
Steps to Schedule an Emailed Chart, Report, or Export
Scheduled emails can be sent to the current logged in user, or one or more user groups. They are created using the web-based Data Display application, located at [Your DataXchange Server]/datadisplay.
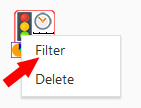
To access schedule options, go to the Filter page for an existing saved item. Either right-click the icon and go to Filter, or click the icon then click the Filter button at the top of the screen.

Scroll to the bottom of the page to find the Scheduling Options.
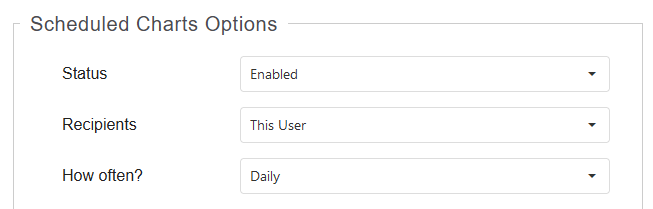
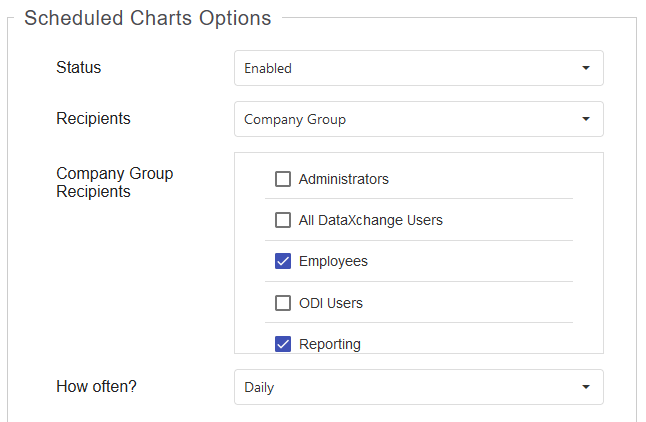
Under Recipients, select either This User or User Group. If User Group is selected, then one or more User Groups must be selected.
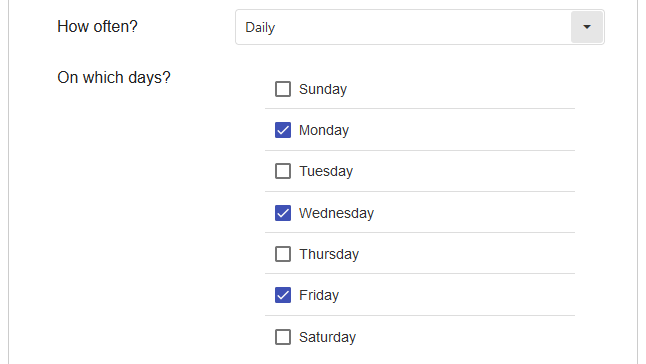
Choose how often to receive the scheduled chart. Options include Daily, Weekly, Monthly, and Quarterly. If Daily is selected, choose the days of the week to receive the chart. If Weekly is selected, only one day of the week may be chosen. If Monthly or Quarterly are chosen, the email will be sent out the First Day of the Month or the First Day of the Quarter respectively.
Select the Time and Time Zone for which the email should be sent out. Note this time zone setting only affects the schedule time and will not affect the timeframe displayed in the emailed data. The timeframe for which data is displayed within the Chart, Report, or Export itself is determined by the Date And Time filter settings at the top of the page.
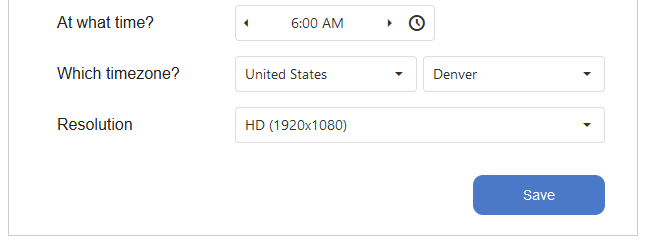
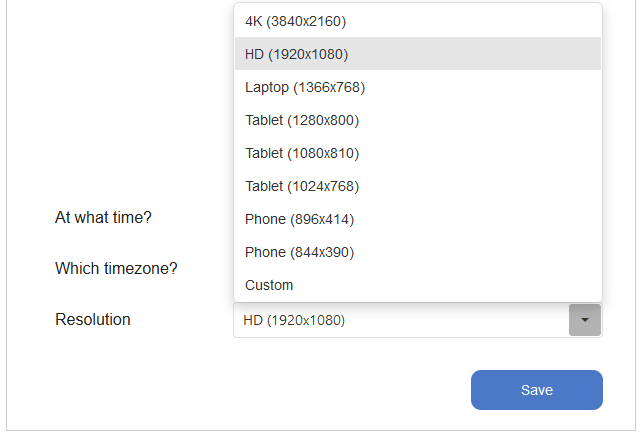
For Charts, select the Resolution at which the chart should be generated. The default is 1920×1080 and a number of preset resolutions are available. A custom resolution can be chosen as well. Reports and Exports are documents with varying sizes based on the amount of data.
When you are happy with the settings, click Save to create the scheduled email.