How can we help?
Saved Charts and Reports
Overview
Saved templates allow for a report or chart to be saved and run with set properties, filters, and options with just a single click.
Saved Charts, Reports, and Exports (or “Reporting Items”) are created in Data Display by selecting an icon from the Launch Pad and choosing the desired filter settings. A user with the appropriate permissions can also create chart or report templates and assign them to user groups allowing users to inherit templates.
Video

Creating and Modifying
To create a new saved Chart, Report, or Export log in to Data Display. Select an icon from the launch pad to go to the Filter page. Configure the options as desired, including Timeframe, Equipment, and additional options. For Equipment, if an entire Plant or Reporting Group is selected, the option to Dynamically Add New Equipment will be available. This will automatically add any new machines to the chart when they are added to the selected Plant(s) or Reporting Group(s).
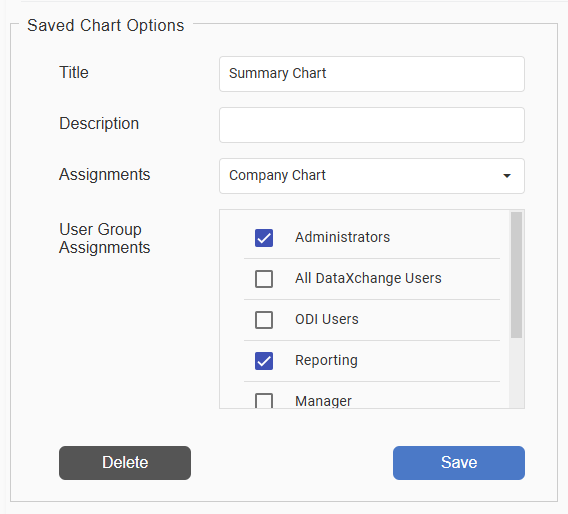
At the bottom of the page, specify the Title, an optional Description, and select an Assignment, either User Chart or Company Chart. If Company Chart is selected, at least one User Group must be selected as well. Note that Custom date ranges can not be saved, however any other Quick Select option can be used with saved charts. Click Save to finish the process.
To view a saved reporting item, click the icon for the Chart, Report, or Export on the Launch Pad. To modify the filter settings, click the filter button in the top-right corner while viewing a Chart or Report. The Filter page for can also be accessed by right-clicking the icon and clicking Filter. Once changes are made, the settings must be saved before viewing the reporting item, otherwise changes may be lost. The reporting item can be deleted by clicking Delete at the bottom of the filter page or by right-clicking the chart’s icon on the Launch Pad and clicking Delete.
Note: For Excel Exports, to view the Filter page you must right-click or long-press the icon and go to Filter.
If settings are modified on the Filter page for a saved item, this message will appear when running the chart, report, or export.
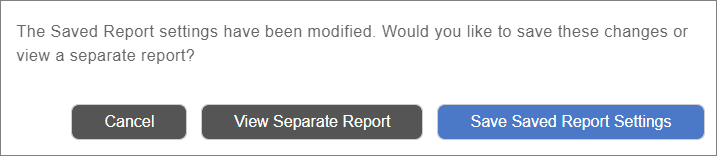
Select whether to view the data without saving filter changes with View Separate Report, or to view the data and save the changes with Save Saved Item Settings.
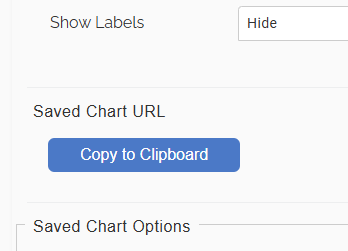
Once a saved chart is created the Custom URL option will be available under Saved Chart URL on the filter page. Click Copy to Clipboard to get a direct web link to the selected chart. Use this URL to send others a link to view the chart. Encrypted credentials are included in the URL, so no DataXchange login is required to view the chart using this link. Only one chart will be viewable per URL.
Note: Custom URLs are currently available for Saved Charts and Real-Time views, they are not available for Reports and Exports at this time.
Scheduling Email Charts, Reports, and Exports
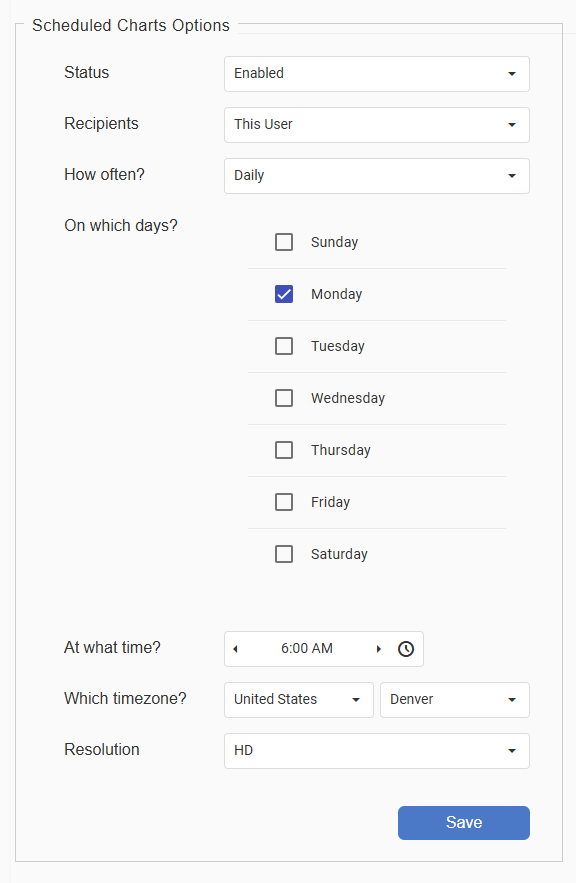
Once a saved reporting item is created, it can be added to a schedule to send to users or user groups via email. The schedule options are found at the bottom of the filter page. Select the currently logged in User or any User Group(s) as the recipient(s) of the chart. Choose a frequency, the days of the week if applicable, and the time at which the chart should be sent out. The Time Zone and Screen Resolution of the chart can also be selected.
Click Save to create or update the chart schedule. If a schedule is active, click Delete to remove it.
Company-Assigned Saved Items
Saved Charts, Reports, and Exports can be configured to be accessible only to specific User Groups. For a user with permission to manage reporting on a company level, the permissions for these Company-Assigned Saved Items can be modified from the Data Display Manage page. Click the menu in the top-left corner to access the Manage page. Scroll to the Company-Assigned Saved Items section. Select from the Type of Chart, Report, or Export, then select an item to modify its User Group Assignments. Click Save when finished.
Add or Modify Saved RTV Charts
To add or modify a Saved RTV Chart go to Charts → My Charts → Add or Modify Saved RTV Charts or Charts → Group Charts → Add or Modify Saved RTV Charts. Specify the Title, an optional Description, and select the Chart Type. Press the Configure button to specify the details for the selected chart type. The title specified will be the title displayed on the chart.
Once a chart is created it can be added to any new or existing RTV screens as a Saved Chart View.