How can we help?
Equipment Status in the RTV
Overview
It is possible to display multiple Equipment Status related charts in the RTV. These can be viewed alongside each other for comparison purposes, or alone for a more focused view. All options have defaults allowing for the Views to be displayed quickly and easily. To get a quick overview simply create a screen, select a view, and save the screen.
Equipment Status Current
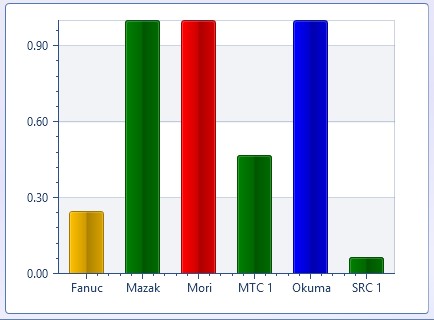
The Equipment Status Current View displays not only the current status of each piece of equipment, but also the amount of time the equipment has been in the current status. Each bar represents a piece of equipment and the height of the bar represents the amount of time in the current status. The assigned colors will be used to identify the active status.
Configuration Options
The Equipment section is used to select the equipment that will be displayed in the View. The Dynamically Add New Equipment checkbox can be used to automatically add new equipment to the View.
The Status section is used to select whether General or Specific Statuses will be displayed for each Status Type.
The following options are available in the Settings section:
- The Time Scale is used to determine the vertical scale of the chart in hours.
- The Font Size is used to set the font of the labels used on the View.
- The Legend is used to show or hide the legend.
If the amount of time for the current status has exceeded the Time Scale that was selected the bar will be the full height of the chart within the view.
Equipment Status Downtime Pareto
The Equipment Status Downtime Pareto View displays the percentage of time that each piece of equipment has been in each downtime status for the time frame selected.
Configuration Options
The Equipment section is used to select the equipment that will be displayed in the View. The Dynamically Add New Equipment checkbox can be used to automatically add new equipment to the View.
The Status section is used to determine a variety of filters relating to the downtime statuses.
- The Downtime Type is used to select Planned, Unplanned or both types of downtime statuses.
- The Cumulative (%) is used to show or hide the cumulative portion of the chart.
- The Cut Off (%) is used to show or hide a line at a selected position in the chart. If Include is selected the percent for the cut off line location can be modified.
- The No Downtimes option will show or hide downtimes with zero time accumulated for the selected time frame.
- The Unknown Downtime option will show or hide unknown downtime on the chart.
- Finally, the list of checkboxes allows the user to define exactly which downtimes to show on the chart.
The following options are available in the Settings section:
- The Font Size is used to set the font of the labels used on the View.
- The Reset Interval is used to determine the start and stop times for selecting the data for the chart.
- Rolling will always count from the last X amount of hours.
- Set Interval will display data from the start time until the current time. It will reset X hours after the start time.
- Example 1: 12 Hours and Start Time 12 AM will display data from 12 AM up to Now until 12 PM, at which point it will display 12 PM up to Now. After 12 AM it will reset.
- Example 2: 8 Hours and Start Time 9 AM will display data from 9 AM up to Now until 5 PM. Afterwards, 5 PM up to Now until 1 AM. Finally 1 AM up to Now until 9 AM at which point is resets.
- Current Shift will use the start time of the current shift.
- The Legend is used to show or hide the legend.
Equipment Status Downtime Summary
The Equipment Status Downtime Summary View displays the percentage of time that each piece of equipment has been in each downtime status for the time frame selected.
Configuration Options
The Equipment section is used to select the equipment that will be displayed in the View. The Dynamically Add New Equipment checkbox can be used to automatically add new equipment to the View.
The Status section is used to determine whether General or Specific statuses will be displayed for each of the downtime Status Types. Specific downtime statuses can also be selected as desired.
The following options are available in the Settings section:
- The Font Size is used to set the font of the labels used on the View.
- The Reset Interval is used to determine the start and stop times for selecting the data for the chart.
- Rolling will always count from the last X amount of hours.
- Set Interval will display data from the start time until the current time. It will reset X hours after the start time.
- Example 1: 12 Hours and Start Time 12 AM will display data from 12 AM up to Now until 12 PM, at which point it will display 12 PM up to Now. After 12 AM it will reset.
- Example 2: 8 Hours and Start Time 9 AM will display data from 9 AM up to Now until 5 PM. Afterwards, 5 PM up to Now until 1 AM. Finally 1 AM up to Now until 9 AM at which point is resets.
- Current Shift will use the start time of the current shift.
- The Legend is used to show or hide the legend.
Equipment Status Summary
The Equipment Status Summary View displays the percentage of time that each piece of equipment has been in each status for the time frame selected.
Configuration Options
The Equipment section is used to select the equipment that will be displayed in the View. The Dynamically Add New Equipment checkbox can be used to automatically add new equipment to the View.
The Status section is used to determine whether General or Specific statuses will be displayed for each Status Type.
The following options are available in the Settings section:
- The Font Size is used to set the font of the labels used on the View.
- The Reset Interval is used to determine the start and stop times for selecting the data for the chart.
- Rolling will always count from the last X amount of hours.
- Set Interval will display data from the start time until the current time. It will reset X hours after the start time.
- Example 1: 12 Hours and Start Time 12 AM will display data from 12 AM up to Now until 12 PM, at which point it will display 12 PM up to Now. After 12 AM it will reset.
- Example 2: 8 Hours and Start Time 9 AM will display data from 9 AM up to Now until 5 PM. Afterwards, 5 PM up to Now until 1 AM. Finally 1 AM up to Now until 9 AM at which point is resets.
- Current Shift will use the start time of the current shift
- The Legend is used to show or hide the legend.
Equipment Status Timeline
The Equipment Status Timeline View displays a stacked bar chart on a time line showing the incremental status of the equipment over the time range selected.
Configuration Options
The Equipment section is used to select the equipment that will be displayed in the View. The Dynamically Add New Equipment checkbox can be used to automatically add new equipment to the View.
The Status section is used to determine whether General or Specific statuses will be displayed for each Status Type.
The following options are available in the Settings section:
- The Time Scale is used to determine the vertical scale of the chart in hours.
- The Scale Label determines whether the the timeline is labeled with hourly intervals or an automatically determined amount based on the selected time scale.
- The Font Size is used to resize the text labels used on the View.
- The Legend is used to show or hide the legend.