How can we help?
Downtime Reports
Overview
Downtime reports consists of two different reports that can be utilized to display different types of downtimes within a specific date range.
Downtime Summary
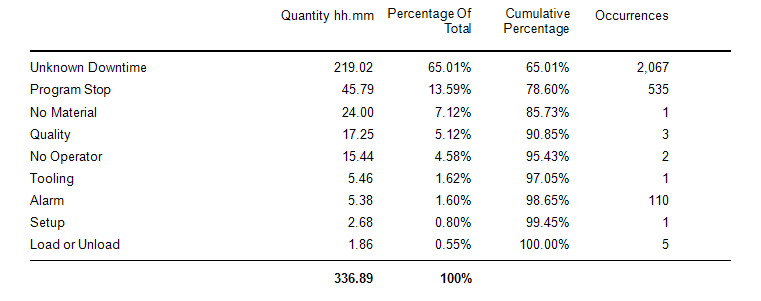
The Downtime Summary report displays the specific planned downtimes, the specific unplanned downtimes, and the unknown downtime for the date range selected. The list of downtime are sorted by the quantity of downtime which displays the amount of time in hours. Then the percentage of the total is displayed along with the cumulative percentage. The number of times each downtime happened is shown in the Occurrences column. Any of these columns can be turned off in Data Display by unchecking the corresponding checkbox in the Data Items section of the Filter page.
A time frame and one or more pieces of equipment are required to generate the report. By default, Today is selected for the time frame. Once the equipment has been selected the Finish and Next buttons become available.
In Data Display, selecting Filter Grouping by User Group or by Equipment Group will enable the Display Grouping option. Display Grouping options include:
- None: Data is displayed aggregated for all selected machines
- By Equipment: Data is broken out by individual machine.
- By Equipment Group: Data is aggregated for each Equipment Group.
Once a date range and equipment have been selected the report can be generated by pressing the Finish button or the Report button in the upper-right corner when using Data Display. Additional optional information can be selected by pressing the Next button in the Windows Application or by scrolling further down the page in Data Display. This section will also give you the ability to select which downtimes to display, filter by Part Number and Work Order, or in customize the Data Items to be shown on the report in Data Display.
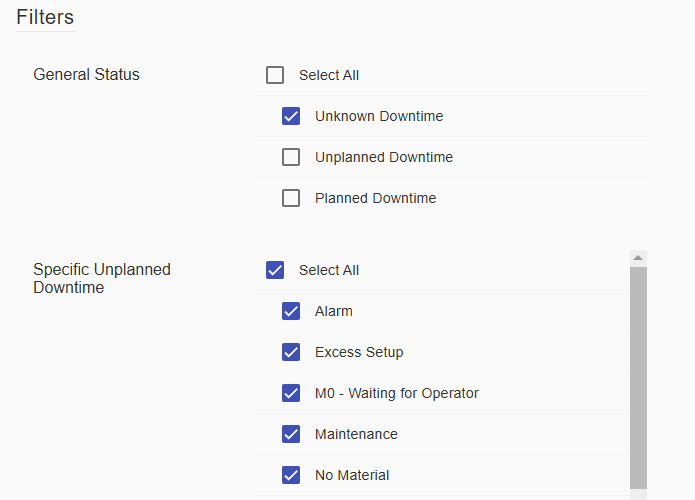
The report can be filtered to include or exclude unknown downtime, planned downtime, and unplanned downtime. It is possible to further filter the chart to only display desired specific statuses. To do this, use the check boxes to indicate which statues should be displayed when generating the chart.
Scheduled Downtime Report
The Scheduled Downtime Report displays information about configured Scheduled Planned Downtimes.
This report can be accessed under the Reports tab → Downtime → Scheduled Downtimes option.
The fields are similar to other reports. A Quick Select or Custom setting can be used to choose a time period for your report.
After choosing the date and time, you will need to select the Equipment you would like to see the reports created for. Click the Finish button to run the report.