How can we help?
Data Display RTV Designer (Coming Soon)
Note: The Data Display RTV Designer is currently in beta. Only a limited selection of Views are available at this time. Contact Scytec or your Reseller to request access.
Overview
The Data Display RTV (Real Time Viewer) Designer is a powerful new web-based version of the dashboard Screen Designer. This new screen designer will soon be replacing the screen designer in the DataXchange Windows Application. Additional options for creating screens are now available, including displaying reports as part of the RTV.
Getting Started
To access this feature, log into Data Display and open the Menu in the top left corner of the screen. Select RTV Designer from the menu.
NOTE: If you do not see the RTV Designer option and would like to try the new designer, please contact Scytec or your DataXchange reseller.
A list of screens that have been created with the designer will be shown. Previously existing RTV screens will not carry over to the designer at this time, but may in the future. Click Add to create a new screen, or select an existing screen and choose from the following options:
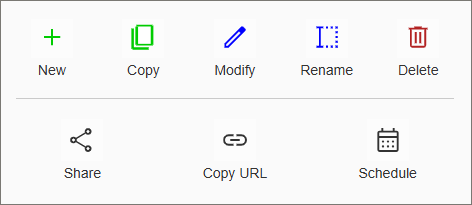
- New: Create a new RTV Screen from scratch.
- Copy: Create a copy of the selected RTV Screen, accessible to the current logged in user.
- Modify: Make changes to the selected RTV Screen.
- Rename: Change the name of the selected RTV Screen.
- Delete: Remove the selected screen from the system.
- Share: Give another user a copy of the selected screen.
- Copy URL: Generate a URL that can be used to view the selected screen in any browser or digital signage system that support URLs.
- Schedule: Send a screen by email to the logged in user or specified User Groups on a schedule.
These options can also be accessed by right-click an RTV screen in the list.
Creating a New Screen
Click New to create a new screen. Initially one blank panel will be shown. Use the Configuration Panel on the left side of the screen to configure the panel. Click on an option under Panel Assigned View to choose what type of content to display. This default starting panel can also be split into multiple different panels. Once a panel has been split, these panels can be removed or repositioned at will.
The Configuration Panel can be moved around the screen by clicking and dragging the header.
Use the [X] button in the top-right of the Configuration Panel, or press the Manage Screen button in the main ribbon bar to return to the list of available RTV screens.
Panel Function Buttons
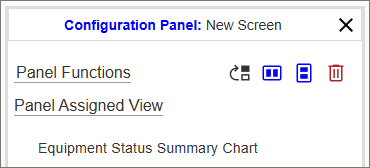
Button descriptions from left-to-right:
- Reposition Panel: Click this button to enable moving a panel around the screen.
- Split Panel Horizontally: Divides the selected panel in half, one panel on the left and one panel on the right.
- Split Panel Vertically: Divides the selected panel in half, one panel on top and one panel on the bottom.
- Delete Panel: Removes the selected panel, including its contents..
Configuring a Panel
Once a View has been assigned to a Panel, the applicable filters will appear below. The Select a Different View button will also appear. Click this button to remove the assigned View and select a different View.
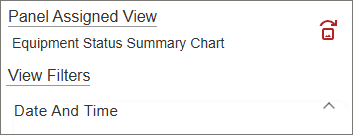
The list of filters will for a View in the RTV Designer be the same as the available filters for the corresponding Chart or Report from their individual Filter pages. A Filter will be highlighted red in the box if a selection is required to display the View. Filters include:
- Date And Time: Select the timeframe of the View. Use a Quick Select option of Current to get data that updates in Real Time. The update frequency will vary based on the amount of time selected.
- Equipment: Select the Equipment for which data will be displayed. Different options are available for Display Grouping depending on the selected View. Some views for example support Display Grouping by Equipment Groups, which will aggregate data on the chart based on groups rather than individual machines. Once Equipment has been selected, click Submit to save changes and preview the View.
- Equipment Status: Some Views allow displaying data for General or Specific statuses. Others will show a list of available Specific and General Statuses and allow for filtering data to display only for the selected statuses.
- Filters: Additional filtering may be available, including filtering by specific Part Numbers or Work Orders.
- Options: Display Options for the View are shown here. These will vary widely depending on the View selected. Examples include:
- Duration Display Format: Determines how time values are displayed.
- Font Size: Size of the text shown.
- Legend: Show or Hide the legend.
- Pop Up Data: Choose whether to display data when hovering the mouse over a chart element.
- Show Labels: Show or Hide labels for different chart elements.
- Align Bars Left: Resizes bars on a bar chart to save screen space.
Click the Submit button to save changes to the Panel and load a preview of the chosen View.
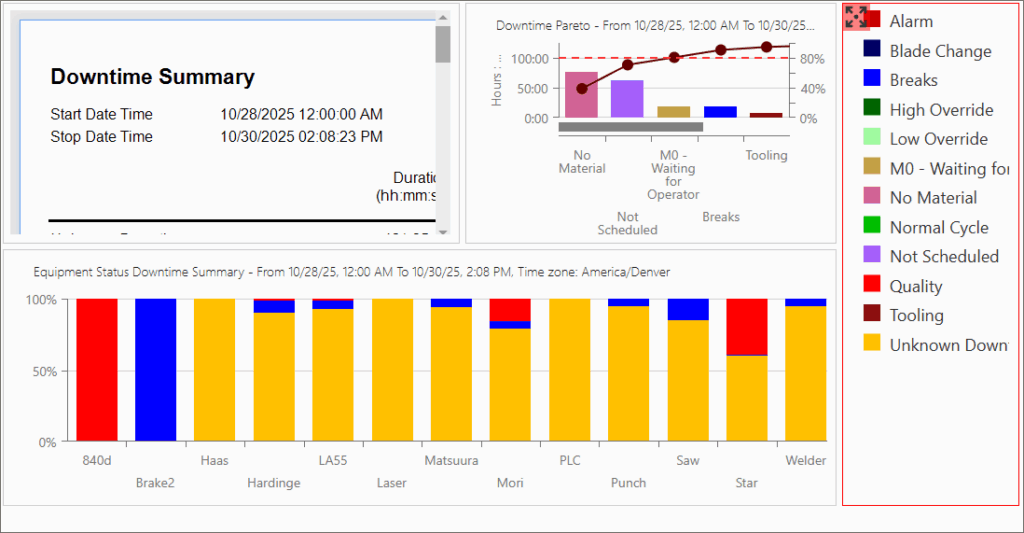
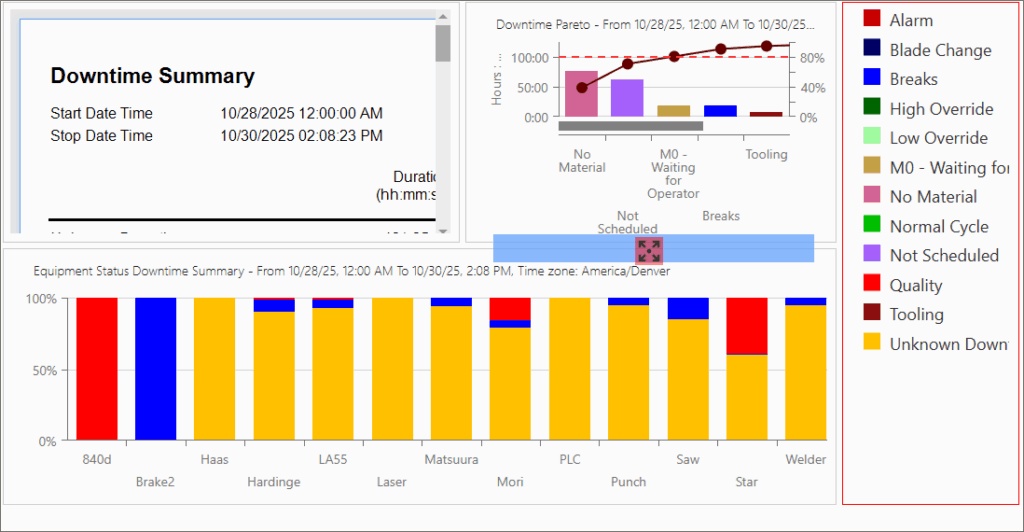
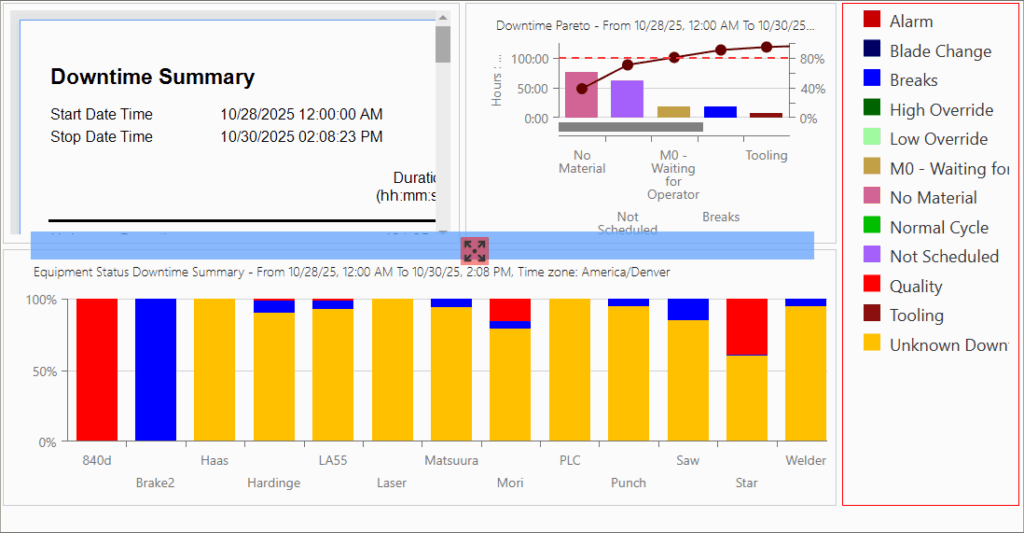
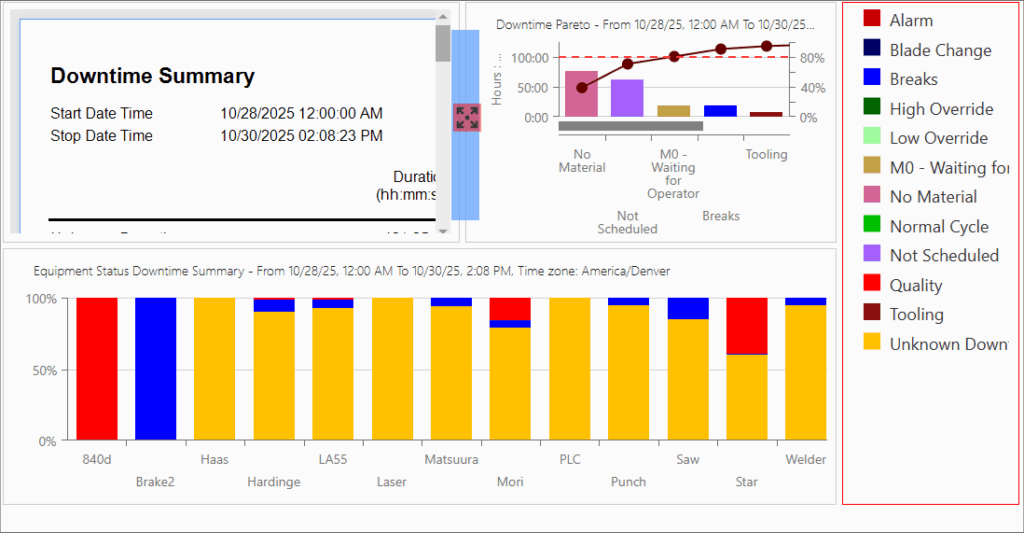
Repositioning a Panel
Clicking the  icon will allow repositioning of the selected panel. When clicked, an icon with a set of arrows will appear in the top-left corner of the selected panel. Click and drag the arrows icon to display the available anchor points around the screen. These will be different depending on the current layout. Some anchor points will expand across the whole screen, and some will be the length of a single panel. These are different anchor points and provide different arrangements. See the below examples: