How can we help?
Alarm Views
Alarm Grid
The Alarm Grid view displays a variety of information about active alarms in a table format. Each of the columns can be hidden, allowing customization to the way the data is shown based of the environment where the RTV is being displayed. It is possible to collect data for a piece of equipment that is in multiple alarms at once. Multiple alarms will be displayed by a new row within the grid for each specific alarm type. If there are no alarms active the rows in the RTV Alarm Grid will change to the color yellow. Active alarms will be displayed in red.
Configuration Options
- Equipment: Select the equipment that will be displayed within the view. Use the Filter Grouping options to choose which equipment sets are selectable.
- Columns: Specify the order as well as which columns should be shown in the Alarm Grid. To customize the way the columns are organized, highlight the name of the column and use the blue arrows on the right to change the displayed order. Items that are unchecked will be hidden from view.
- Grid Settings: Select the text size and time period for which data is pulled.
Columns Available
- Equipment: The given name of the machine within the Alarm Grid.
- Alarm Type: How the alarm is categorized according to the machine.
- Alarm Code: The alarm code provided by the machine.
- Alarm Description: Additional detail about the alarm provided by the machine.
- Duration: Total time that the equipment has been in an alarm.
- Quantity: The amount of times the equipment has gone into an alarm.
- Sum: A summation of time the equipment has been in an alarm.
- MTBF (Mean Time Between Failures): The average time elapsed from one failure to the next.
- Average: The average duration of alarms on the machine over the configured timeframe.
Reset Interval
This is used to determine when the alarm data displayed in the grid will reset.
- Rolling will always count from the last X amount of hours.
- Set Interval will have a start time and then reset every X amount of hours from the specified start time.
- Current Shift will use the start time of the current shift.
Expressions
In order to display alarm data within the RTV Alarm Grid, an Alarm Capture expression will need to be assigned to each piece of equipment.
Here’s an example of an expression that would capture alarm data for a machine using MTConnect.
Expression:
([MTC.alarms] != [MTC.prev_alarms])
Result:
[PCSDB.send_alarms] {[MTC.alarms]}
Alarm Code Mappings for MTConnect
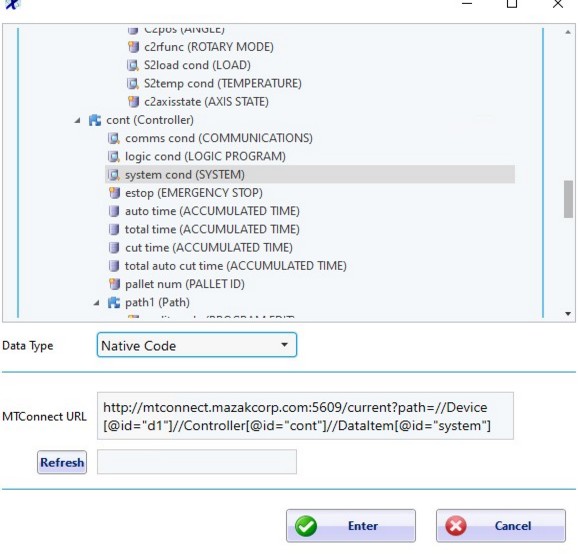
Alarm codes for MTConnect are called conditions. Here is an example screenshot of where to find it. You will need to make sure to select the “Native Code” from the Data Type drop down.
Expect to see an error stating that the request did not return any data if your machine is not currently in an alarm. It is still okay to save this mapping.
Alarm Pareto
The Alarm Pareto view displays data collected from the alarm codes recorded by machines that have a Focas or MTConnect back end. This feature takes advantage of the Alarms generated by the machines and records that information within the database. For instance, if there are two alarm codes being generated at that time DataXchange will record both of them. This data can then be used to detail out which alarms are happening and the time stamp associated with the alarm event. See above for details on Equipment selection and Reset Interval options.
Alarm Options
- Chart Type: Choose either By Occurrence or By Time (the default). The first is a Pareto of occurrences which will display occurrences and have the time listed on the top of each bar. The second is a Pareto of time which will display the amount of time and have the total occurrences listed on the top of each bar.
- Cumulative (%): Show or hide the line indicating cumulative frequency of alarm states.
- CutOff (%): Show or hide a cutoff line and determine where the line is placed.