How can we help?
Scrap Pareto Chart
Overview
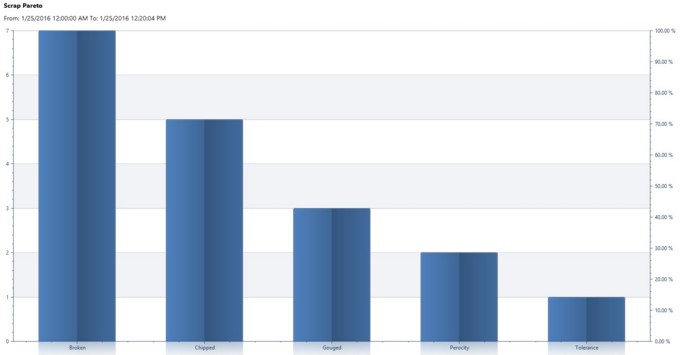
The Scrap Pareto chart displays the amount of scrap parts and the percentage compared to the total amount of scrap parts over the time frame selected. The different scrap part reasons are listed at the bottom of the chart and will span from left to right by the highest to lowest percentage.
Required and Optional Information
A timeframe and one or more pieces of equipment having valid scrap parts are required to generate the chart. By default, Today is selected for the time frame. Once the equipment has been selected the Finish and Next buttons become available. At this point the chart can be generated without specifying any additional information by pressing the Finish button. Additional optional information can be selected by pressing the Next button.
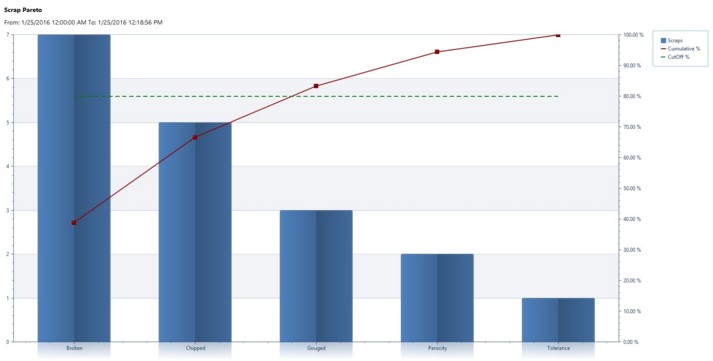
On the second page of the filter the Cumulative and Cut Off percentage lines can be enabled or disabled.
If a chart is not generated successfully, ensure scrap parts have been recorded for the selected machines during the chosen timeframe.
Sample Scrap Pareto Charts