How can we help?
Operation Time Chart
Overview
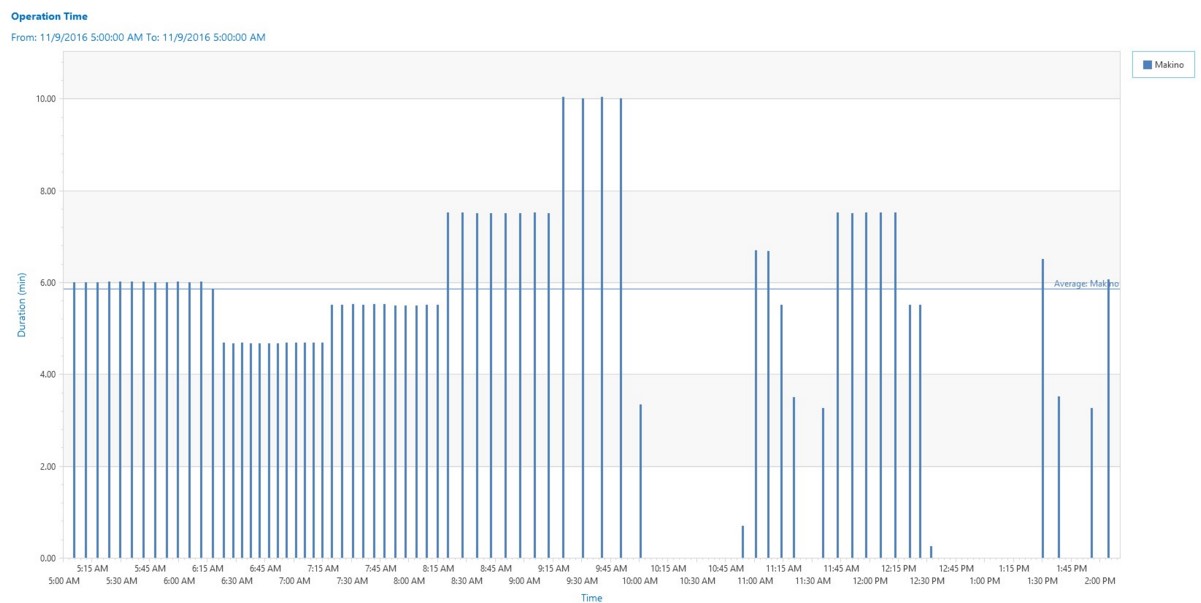
The Operation Time chart displays the amount of time between individual part counts. The chart displays the Duration (in minutes) and the start time for when the event occurred.
Required and Optional Information
A time frame and one or more parts are required to generate the chart. By default, Today is selected for the time frame. The chart can be generated without specifying any additional information by pressing the Finish button. Additional optional information can be selected by pressing the Next button.
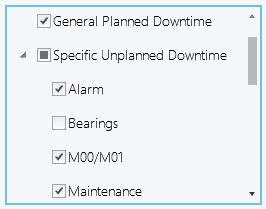
The Next screen will display many different options to alter the data being displayed. It is possible to further filter the chart to only display desired specific statuses. To do this, use the check boxes to indicate which statues should be displayed when generating the chart. If the status box is checked and there is historical data, it will be displayed.
- Chart type: Bar or Plot – The chart type determines the appearance of the chart.
- Part Count Type: Good or Good and Scrap – The part count type provides the ability to include or exclude scrap parts.
- Exclude Greater Than: Use this to filter outliers above this threshold.
- Exclude Less than: Use this to filter outliers below this threshold.
The list of status types provides the ability to define the type of operation time to plot. For example, if General Cycle Time is selected then the total amount of cycle time between each part is used for each data point. If General Cycle Time and Unknown Downtime are used then the total cycle time plus the idle time between each part is used for each data point. An average line is generated with the report to help you identify any outlier data points.