How can we help?
Downtime Charts
Overview
Downtime charts display information specific to equipment downtime, excluding information regarding cycle time. Generally this includes Planned, Unplanned, and Unknown downtime as well as the specific statuses comprising Planned and Unplanned downtime.
Required and Optional Information
A time frame and one or more pieces of equipment are required to generate these charts. Once the equipment has been selected the Finish and Next buttons become available. At this point the chart can be generated without specifying any additional information by pressing the Finish button. Additional optional information can be selected by pressing the Next button. This section also allows you to filter by part number and work order if desired.
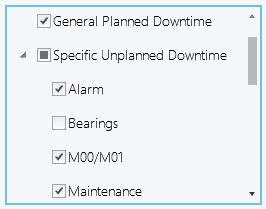
It is possible to further filter the charts to only display desired specific statuses. To do this, use the check boxes to indicate which statues should be displayed when generating the chart.
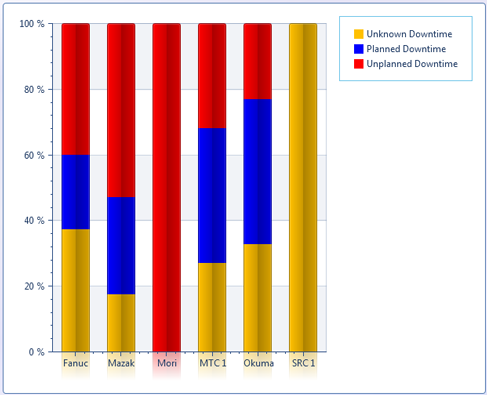
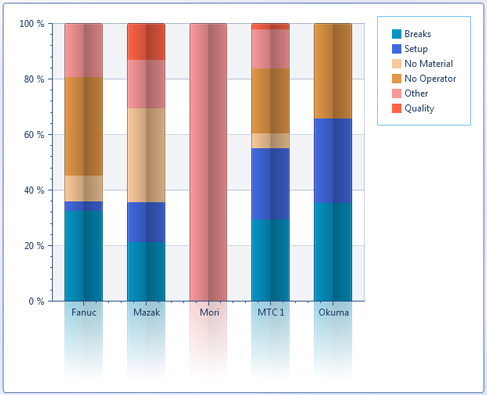
Downtime Summary Chart
The Downtime Status Summary chart displays the percentage of time that each piece of equipment has been in each downtime status for the time frame selected. The Equipment can be selected by User Groups, Company Groups, or by the Equipment. When displaying the result the statuses can be shown for individual equipment or by the selected group type. The default date range is Today.
The second page of the filter can be used to select the type of statuses to be compared. By default the General statuses are selected for the planned and unplanned downtimes.
For Planned and Unplanned Downtime either the General Status can be viewed or the General Status can be broken down showing each of the Specific Statuses.
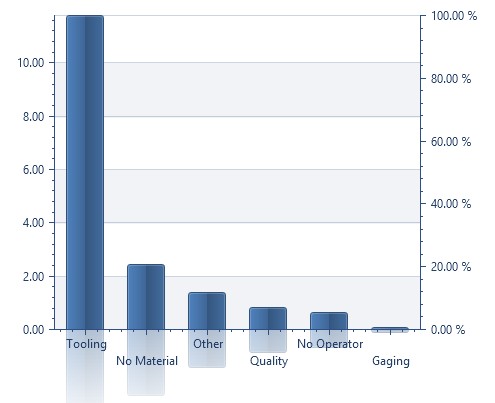
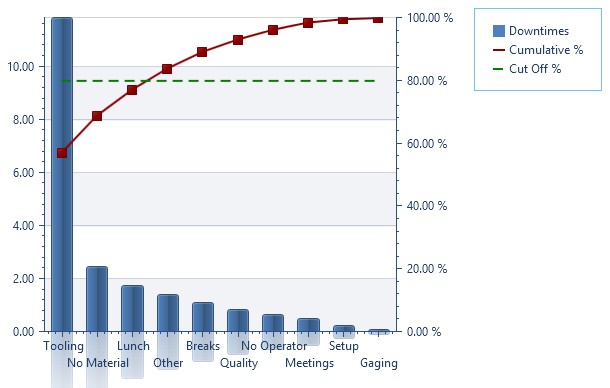
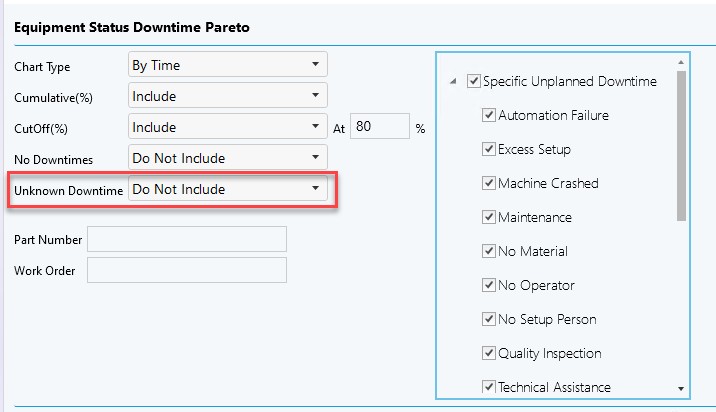
Downtime Pareto Chart
The Downtime Status Pareto chart displays the amount of time and occurrences for the selected downtime statuses and selected equipment for the time frame selected. The Equipment can be selected by User Groups, Company Groups, or by individual Equipment. Shifts or Shift Groups can also be selected.
The second page of the filter can be used to filter the type of chart and statuses that will be selected. The default chart will be By Time but you can also run this report By Occurrence. By default the Downtime Type of Planned and Unplanned will be selected. The Cumulative and Cut Off percentage lines can be enabled or disabled. Downtimes that do not have any time associated with them during the selected time frame can be excluded as well. There is also an option to display the Pareto chart by occurrence or time.
- No Downtimes: Can be used to display any downtimes that have no recorded data within the selected timeframe. If you wish to see these downtimes, select include.
- Unknown Downtime: Allows the option to include the general status, Unknown Downtime in the Pareto chart. This is set to Do Not Include by default.
- Part Number: Can be used to run this chart for a specific Part Number.
- Work Order: Can be used to run this chart for a specific Work Order.
Examples