How can we help?
Average Operation Time Report
Overview
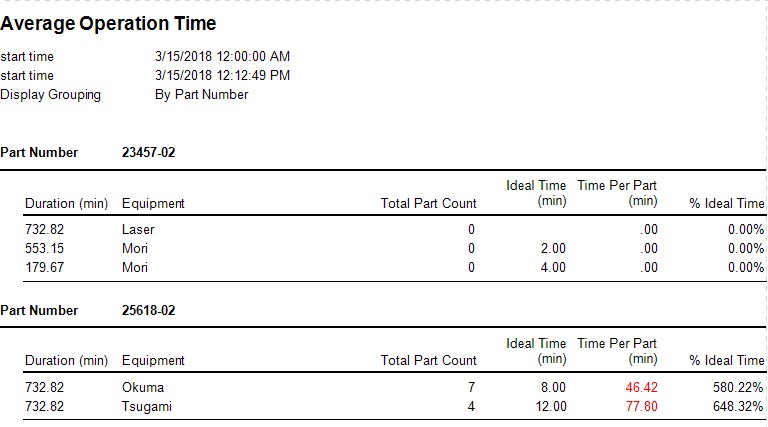
The Average Operation Time report is used to find the average operation time per part within a specific period of time. The report is broken down and displayed by part.
The filter can be used to display specific parts by selecting check boxes next to the desired parts. By default all parts are selected but it is possible to search and further narrow down your results by typing into the text box above.
Required and Optional Information
A time frame, an equipment, and one or more parts are required to generate the report. Click the Report button in the top-right to generate the report. Additional optional information can be selected to filter further or change how the report data is grouped.
Additional options available include:
- Report Grouping: Optionally group report data by part number.
- Part Count Type: Select from Good parts or Good and Scrap parts.
- Cycle Statuses: Choose which cycle statuses to display, either general or specific cycle statuses.
- Equipment List: Select the equipment for the report.
- Duration Display Format: Select how time values will be displayed.
Calculations
The values in the Average Operation Time report are calculated as follows.
Definitions
- Cycle Time Duration: Amount of Cycle Time based on Cycle Status filter.
- Part Count: Total Part Count from Part Start to Part End.
- Ideal Time (min): Ideal Time in minutes to produce a part.
Formulas
- Time Per Part (min): Cycle Time Duration (min) / Part Count
- % Ideal Time: Time Per Part / Ideal Time (min)